Molecular Biology of the Cell 11: 3873 - 3883, 2000
Affinity Amplification in EGF Receptor-Mediated Chemotactic Responses
Maryse Bailly*, Jeffrey Wyckoff*, Boumediene Bouzahzah#, Ross Hammerman*, Vonetta Sylvestre*, Michael Cammer*, Richard Pestell#, and Jeffrey E. Segall*+
Departments of *Anatomy and #Developmental and Molecular Biology
Abstract
To determine the distribution of the EGF receptor on the surface of cells responding to EGF as a chemoattractant, an EGF receptor-Green Fluorescent Protein (EGFR-GFP) chimera was expressed in the MTLn3 mammary carcinoma cell line. The chimera was functional and easily visualized on the cell surface. In contrast to other studies indicating that the EGF receptor might be localized to certain regions of the plasma membrane, we found that the chimera is homogeneously distributed on the plasma membrane, and becomes concentrated only during endocytosis. In spatial gradients of EGF, endocytosed receptor accumulates on the upgradient side of the cell. Visualization of the binding of fluorescent EGF to cells reveals that the affinity properties of the receptor together with its expression level on cells can provide an initial amplification step in spatial gradient sensing.

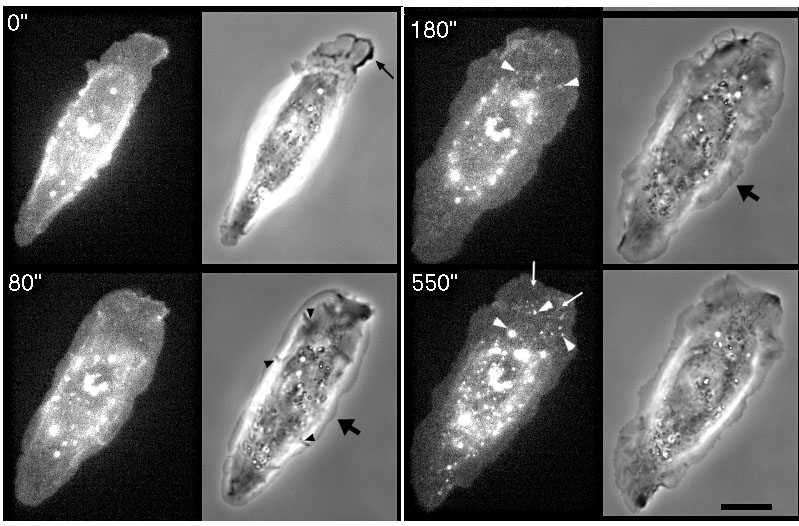
More cells. Response of an E11 cell to addition of 5 nM EGF at 0 sec using phase contrast(right) and GFP fluorescence(left). Thin black arrow, ruffle; black arrowheads, dorsal protrusions; large black arrow, extending lamellipod; white arrowheads, large EGFR-GFP containing vesicles; white arrows, small EGFR-GFP containing vesicles. Bar, 10 um.

Figure 3. Internalized EGFR-GFP accumulates on the source side of the cell in spatial gradients of EGF. A pipet containing 50 uM EGF was placed next to an E11 cell at 0 seconds, and cell responses followed in phase (right) and GFP fluorescence (left). Black arrows point at a ruffling area, showing increase in EGFR internalization (white arrowheads). Bar, 10 um

Figure 4.Movement of membrane vesicles during lamellipod extension. The cells were starved for 2 hours, then exposed to NBD-C6-SM for 30 min, followed by imaging on the Olympus CCD station. At time 0, 5 nM EGF with 0.35% BSA was added to the cells. The addition of BSA allows the visualization of recycling vesicles by removing the label from the plasma membrane. Phase contrast (A and B) and fluorescence (C and D) images of a cell 60 sec (A and C) and 220 sec (B and D) after addition of EGF. (E) is a superposition of the fluorescence images together with the phase image of the top of the cell in (B). It shows the paths taken for all the vesicles observed in the lamellipod area. The origin of each vesicle is shown as a white ring, and the different colors show the directions of movement of different vesicles (some of which split to form multiple progeny). The white outline indicates the position of the edge of the lamellipod in (A), before extension has occurred. During EGF-induced lamellipod extension, most vesicles move towards the upper right side of the cell although lamellipod extension occurs over the entire top of the cell. Bar, 10 um.
Figure 6a. Affinity amplification in chemotactic responses. (A). TMR-EGF is concentrated on the surfaces of cells. A pipet filled with 25 uM TMR EGF was placed near E11 cells and a pressure pulse causing a saturating release of TMR-EGF was initiated at 0 seconds. Weak autofluorescence of the cells can be seen before the release of TMR-EGF. Phase (left) and TMR-EGF fluorescence (right) are shown.
Figure 6b. Affinity amplification in chemotactic responses. (B) Internalized TMR-EGF and EGFR-GFP accumulate on the sides of cells closest to the micropipet. Pressure ejection from a pipet filled with 50 nM TMR-EGF was initiated at 0 seconds and cells were imaged using phase contrast (left), GFP fluorescence (green, right), and TMR-EGF fluorescence (red, right). Bar, 10 um.
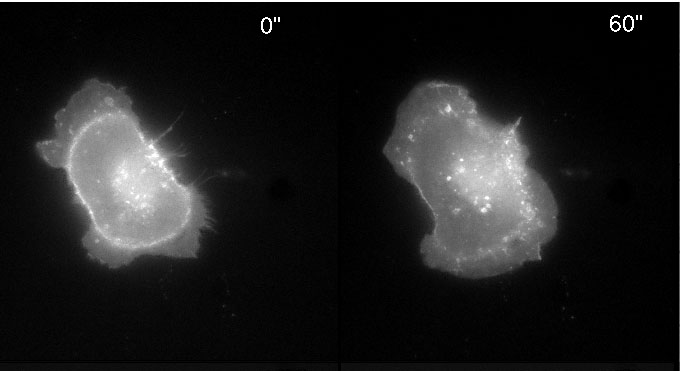
Rotation of a Cell expressing the EGFR-GFP fusion. An MTLn3 cell expressing the EGFR-GFP fusion was imaged as a z series using an Olympus microscope. The image stack was then used to generate the rotation shown in the movie.